BLACKDENE CONSULTING

Botanical Survey & Ecological Data Visualisation

Bridging ecology, decision-making, and data

Your surveys generate excellent data. But static reports and spreadsheets don't let stakeholders explore it themselves. I build interactive applications that turn botanical and ecological datasets into tools decision-makers can interrogate.

Combining field ecology with R-based data development to make complex ecological data accessible, transparent, and useful.

About

Ecology-aware data tools that work in practice

I'm Richard Friend — a FISC Level 5 field botanist and R developer with five years' experience on national monitoring programmes for UKCEH, Natural England, and Welsh Government. I've collected data under bespoke protocols in the field, worked with data at scale, and have seen how organisations use ecological evidence in strategic planning.

That perspective matters. Conservation organisations often commission excellent surveys, but the results end up locked in spreadsheets or static reports. When decision-makers can't explore the evidence themselves, data can struggle to influence strategy, funding applications, or long-term planning.

I specialise in bridging that gap. I design interactive tools that translate ecological data into something stakeholders can interrogate, understand, and trust — without requiring technical expertise or waiting for custom outputs.

One example: over 30,000 botanical records were underused because a charity's stakeholders couldn't access them meaningfully. The interactive map I built changed how the organisation communicates its work and engages stakeholders with the data. I build similar tools for organisations facing the same challenge.

Availability: development projects October–April, with capacity for smaller projects year-round.

Background

  • Field experience: FISC Level 5, Five years on national monitoring programmes
  • Technical skills: R programming, Shiny development, statistical ecology, spatial analysis
  • Qualifications: MSc Biological Recording; PgDip Business Management
  • Leadership & governance: Experienced Executive and Non-Executive Company Director (30 years +); Charity Trustee (Teesdale Special Flora); Community Representative, North Pennines National Landscape
  • Education & training: BSBI Identiplant Tutor (2015–2024), Education Tool Developer
  • Data quality: Vascular Plant Record Verifier (VC66) for iRecord and iNaturalist

Data Visualisation Services

Making survey data visible, credible, and useful

The problem: Survey datasets typically contain insights beyond what's presented in a static report. When decision-makers can't explore the evidence themselves, the data often fails to inform strategic decisions as effectively as it could.

The difference:

Static outputs (typical survey deliverables):

  • Fixed maps showing one view
  • Can't be re-filtered or updated
  • Require technical expertise to interpret
  • Become outdated as new data arrives

Interactive applications:

  • Stakeholders explore data themselves
  • Filter by year, species, habitat, land parcel
  • Non-specialists can answer their own questions
  • Update automatically when new survey data is added
  • Work across multiple sites or monitoring rounds

The solution: Custom interactive applications built by someone who understands ecology, data, and how organisations use evidence. I work with you to turn survey datasets into tools that:

  • demonstrate value to funders and partners
  • support strategic decisions
  • improve transparency and confidence in the evidence base
  • allow non-specialists to explore data safely and intuitively

Typical delivery:

  • Scoping and data review
  • Prototype development
  • Iterative refinement with stakeholders
  • Deployment and handover (with optional ongoing support)

When interactive tools matter

This approach is most valuable when:

  • Multiple people need to explore the data (decision-makers, funders, land managers)
  • You'll collect similar data next year (monitoring programmes, repeated surveys)
  • Decisions depend on understanding spatial or temporal patterns
  • Stakeholders ask questions faster than specialists can produce custom outputs
  • You need to demonstrate value to funders or justify ongoing investment
  • Land managers need to compare sites and prioritise interventions based on conservation value
  • Field recorders and volunteers need to understand how their observations contribute to site management and conservation decisions

Reducing reporting burden: For multi-year monitoring programmes or funded projects, building visualisation into your initial funding application creates infrastructure that automatically generates interim reports and funder updates. This typically saves significant staff time and reduces the stress of producing custom outputs for each reporting cycle.

Preserving institutional knowledge: Survey data often represents years of fieldwork, but when staff move on, the context and patterns they understood are lost. Interactive visualisation preserves this spatial and temporal knowledge in an accessible form, allowing new team members to understand site history and make informed management decisions without relying on individual memory.

What I build

  • Interactive species distribution and habitat maps
  • Vegetation community and monitoring dashboards
  • Data exploration tools for decision-makers and partners
  • Custom identification and training apps
  • Educational resources for field teams
  • Data exploration interfaces for researchers and technical staff

Portfolio: Data Visualisation

Turning datasets into tools organisations actually use
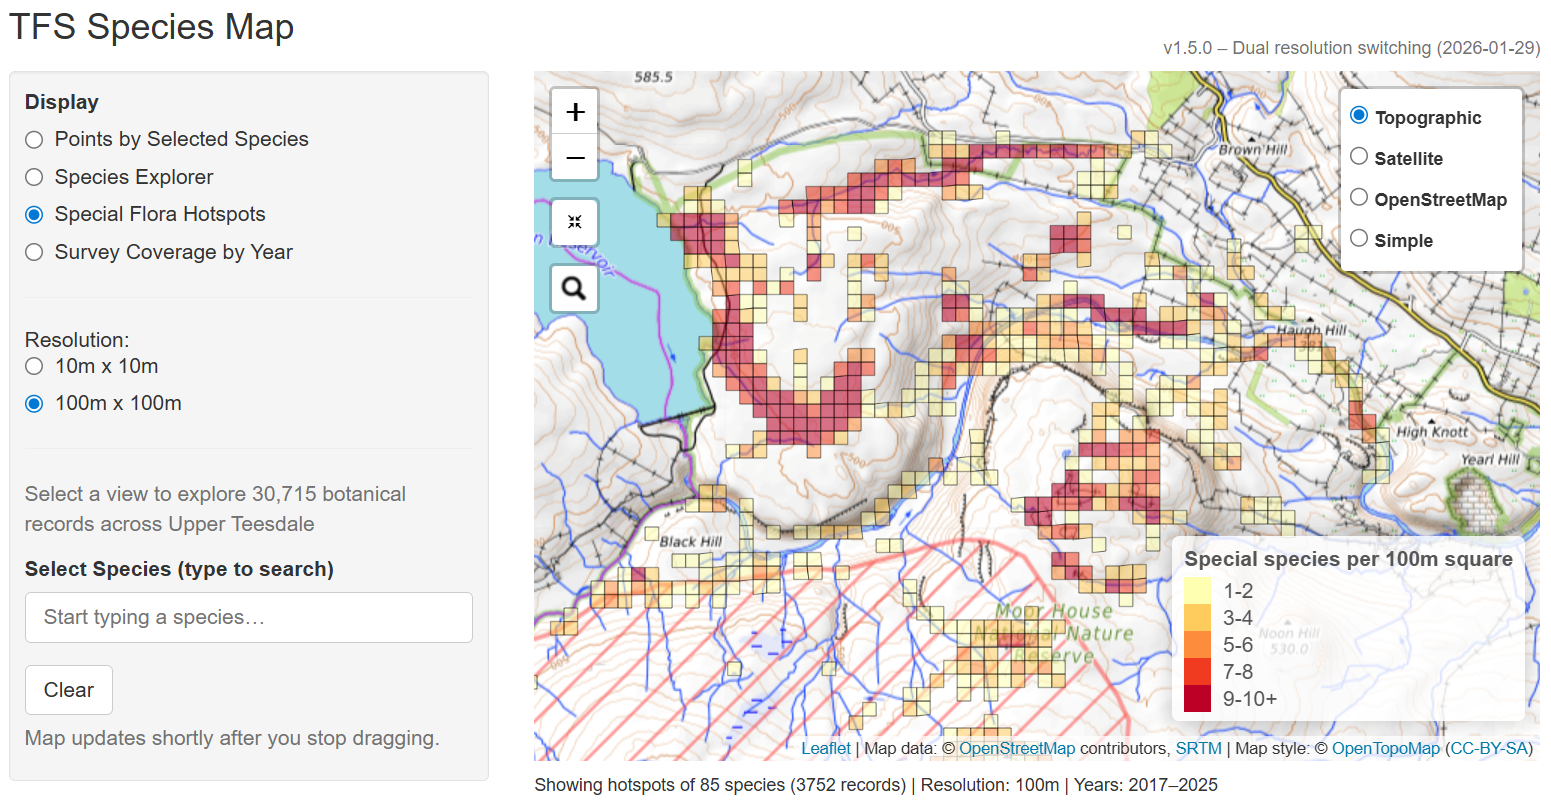
TSF Species Map interactive visualisation interface

TSF – Species Map

30,000+ records (2017–2025)

Challenge: Nine years of botanical data (30,000+ records) in spreadsheets. Stakeholders couldn't explore patterns in this important dataset and had to wait for custom outputs to understand species distribution and community hotspots.

Outcome: An interactive tool now lets anyone filter by species, plant community, species richness at multiple grid resolutions, or by survey area. New data can be incorporated without rebuilding the entire application.

Launch Tool
ERIC North East Invasive Species Map interface

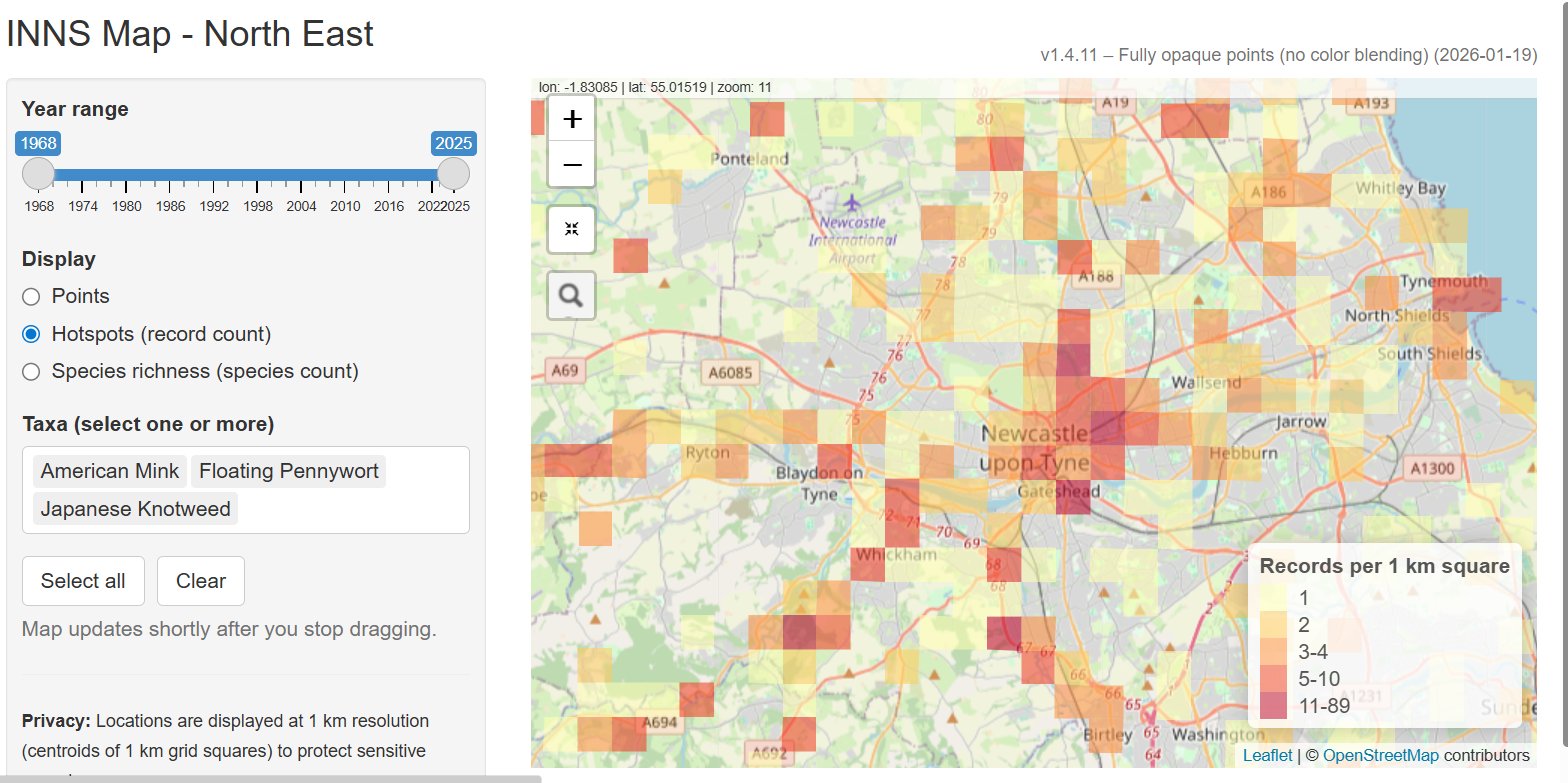
ERIC North East – Invasive Species Map

Commissioned by Environmental Records Information Centre North East

Challenge: Need for a clear, public-facing tool to engage stakeholders with invasive non-native species data.

Outcome: An interactive mapping application with species richness heatmaps and filterable records, successfully deployed on ERIC's website.

Launch Tool

Portfolio: Field ID Learning Tools

Supporting skills development in the field

Field identification skills are essential for ecological surveys. These interactive learning tools address common identification challenges with progressive reveal functionality, diagnostic images, and mobile-optimised interfaces that support learning anywhere.

Identiplant App

Collaborative BSBI project supporting its Identiplant course through interactive identification tools and structured learning.

Launch Tool

Lichen Identification Tool

Originally developed for Natural England's England Ecosystem Survey; now a public training resource supporting surveyors learning key indicator species.

Launch Tool

Liverwort Identification Tool

A self-directed learning resource addressing common identification challenges, designed for use on mobile devices.

Launch Tool

Field Experience

Understanding the context behind the data

My development work is grounded in extensive field experience and practical survey delivery:

  • National monitoring programmes including England Ecosystem Survey, Countryside Survey, and ERAMMP
  • Experience across habitats in England, Scotland, and Wales
  • Practical knowledge of NVC, UKHab, BNG, Phase 1 and Phase 2 surveys
  • Analysis and management of large botanical datasets in R

This ensures the tools I build reflect real survey workflows, data structures, and constraints — not abstract technical assumptions.

Who I work with

I typically work with:

  • Conservation charities and trusts
  • Environmental NGOs
  • Local and regional environmental records centres
  • Statutory bodies and monitoring programmes
  • Partnerships needing to communicate evidence to funders

If you're sitting on a dataset that isn't informing decisions, strategy, or funding conversations, it's probably worth a discussion.

Contact

Director

Richard Friend
Blackdene Consulting Ltd

Email

[email protected]

Address

Dene House, West Blackdene
Bishop Auckland
County Durham, DL13 1EQ